MATTHEW ADNER
This site is a work in progress.
Please look around, but keep in mind that some sections are still being updated.
Experience
Summer Analyst
TVG Consulting – Remote
- Built an AI tool to collect, clean, and integrate public data into a proprietary dataset for market research.
- Contributed to buy- and sell-side due diligence in digital infrastructure, focusing on growth, valuation, and synergy.
- Informed strategic and operational recommendations through market research and expert interviews; supported client relations.
- Developed financial models and performed geospatial and data-driven analyses to support M&A strategy and execution.
Jun 2025 – Aug 2025
Co-President; Quantitative Strategies Group Founder/Leader
Student Investment Fund at Union College – Schenectady, NY
- Lead meetings of 50+ members, set agendas, coordinate investment discussions, and ensure productive collaboration among sector leaders and their analyst teams.
- Co-manage over $1,000,000 of the college’s endowment in an equity/fixed income portfolio.
- Founded group within the fund dedicated to investing based on quantitative strategies rather than fundamental analysis. View slides.
- Practiced backtesting, trading analysis, and portfolio optimization, improving data manipulation, analysis, and visualization skills.
- Explained technical processes and systems to non-technical audiences in an approachable manner.
- Formerly Real Estate sector leader, where my team and I pitched a REIT. Read about it here.
- Presented on financial derivatives, not including options. View slides.
- Presented on options, focusing on basics and teaching a rough price intuition. View slides.
2022 – Present
Research Assistant to Prof. Brian Melzer
Tuck School of Business at Dartmouth College – Hanover, NH
- Analyze large sets of real estate price data to identify trends and patterns.
- Translate successful equity market trading strategies to real estate markets and backtest their effectiveness.
- Develop R code to synthesize data and findings into clear visualizations and dashboards.
- Synthesized real estate transaction data into MBA case study materials on investment strategy and property valuation.
June 2023 – February 2025
Assistant Scientist and Mentor
NH Academy of Science Summer Program – Lyme, NH
- Taught modules on computer science, machine learning, computer vision, 3D modeling, and Arduino for students aged 13-18.
- Trained students in research and lab procedures, advising experiment design, execution, and analysis.
- Co-managed social media accounts, web presence, and directed various outreach efforts nhacadsci.org.
Summers 2022 – 2023
Teaching Assistant: Introduction to Computer Science
Hanover High School – Hanover, NH
- Designed exercises, presented lectures, and worked with students individually and in small groups.
- Graded assignments and developed software for student interaction measurement.
- Developed software for student interaction measurement. Project GitHub Repository.
September 2021 – August 2022
Ski Instructor
Dartmouth Skiway Snowsports School – Lyme, NH
- Led beginner and intermediate ski lessons for individuals and groups of all ages.
- PSIA Alpine Ski Level 1 Certified.
Winters 2018 – 2021, 2023
Student Researcher
New Hampshire Academy of Science – Lyme, NH
Summers 2018 – 2021
Projects
Quantitative Trading Algorithm and Backtesting System
This project is a custom-coded algorithmic trading system I built from the ground up using python and the libraries Pandas, Numpy, Plotly. The goal was to create a tool that could scan the market (over 16 million datapoints), identify promising opportunities based on indicators, and track simulated trades over time.
Data Processing
This component cleans and aligns data from multiple sources while handling messy
edge cases, like companies with multiple share classes or that didn't have
historical price data. The data is formatted as a 3-dimensional dataframe with
axes representing different stock tickers, different attributes like price or
indicators, and time. This structure allows operations to be far more
computationally efficient.
Custom Indicators
One of the main signals I built measures how far a stock is trading outside of
its usual range. It combines rolling linear regression and standard deviation
calculations to flag when price action deviates significantly from recent
trends.
Stock Selection Logic
The strategy filters the entire market down to a refined list of tradable stocks
by combining a custom signal designed to detect abnormal price behavior, other
quantitative indicators, and a set of rule-based screens. These filters help
exclude companies with undesirable attributes such as low liquidity or companies
headquartered in tax haven countries, and apply rolling calculations to smooth
out noise. The result is a focused subset of equities that stand out for their
risk/reward profile.
Portfolio and Trade Tracking
The portfolio system consists of several interrelated classes. At its core are
classes that manage individual positions and full portfolios, allowing for
accurate tracking of trades, position-level metrics, and portfolio-level
performance over time. These classes are designed to simulate realistic trading
behavior, including variable position sizing, dynamic position entries and exits
based on current unrealized profits, losses, and changes in the indicators that
informed the position entry. The simulation also accounts for variable trading
costs based on company size and trading volume, allowing for a more accurate
reflection of real-world execution and slippage.
In addition, a trade analysis class tracks every trade made during the
simulation. Once the backtest is complete, it performs a set of analyses on
portfolio outcomes and trade patterns. It allows users to view performance based
on a variety of attributes including sector, market cap, indicator, and trade
duration, making it easier to see where profits and losses came from and which
subsets of the market the strategy was most profitable over.
Together, these components make it easy to understand how the strategy behaves
across different market conditions and help refine future iterations.
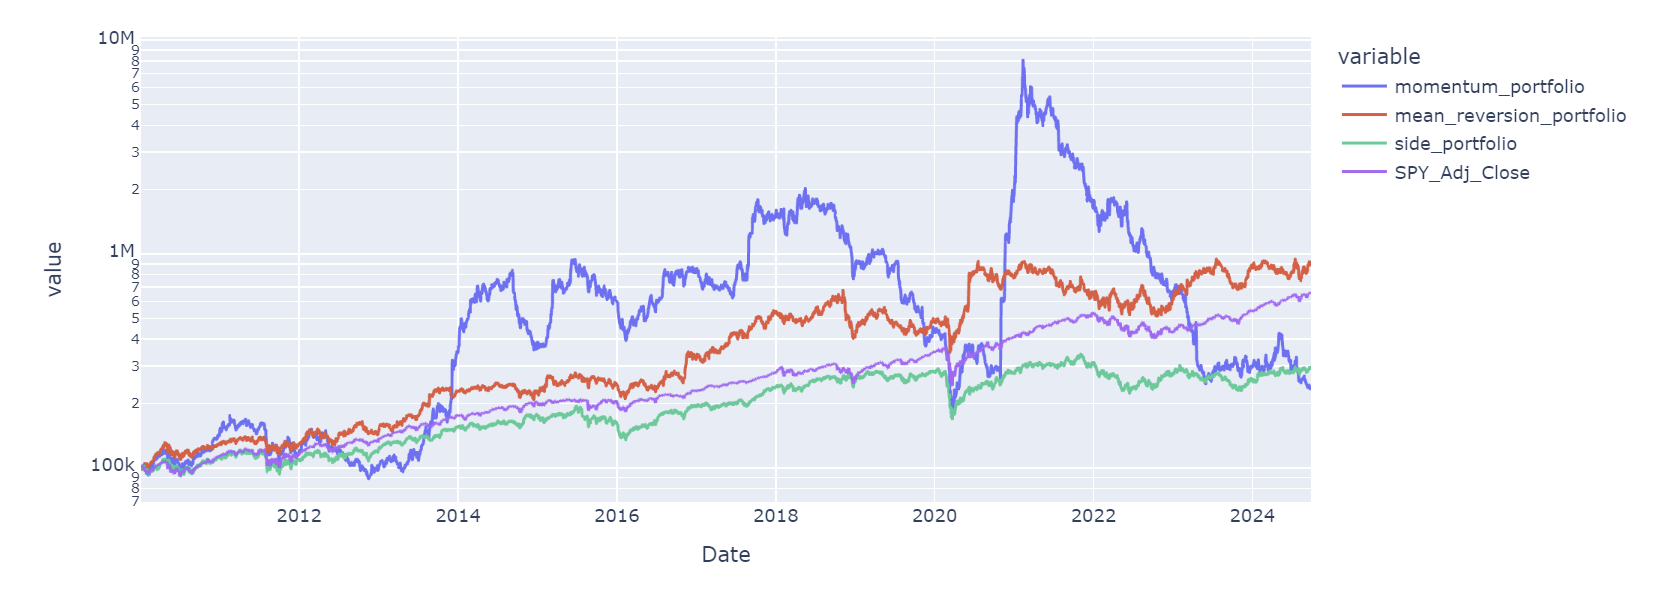
Portfolio Value Over Time. A line plot comparing the value of three portfolios based on different strategies, and a fourth benchmark portfolio linked to the SP500. This visualization helps show the relative performance and volatility of each portfolio and provides an intuitive understanding of how the strategies tracked against the broader market.
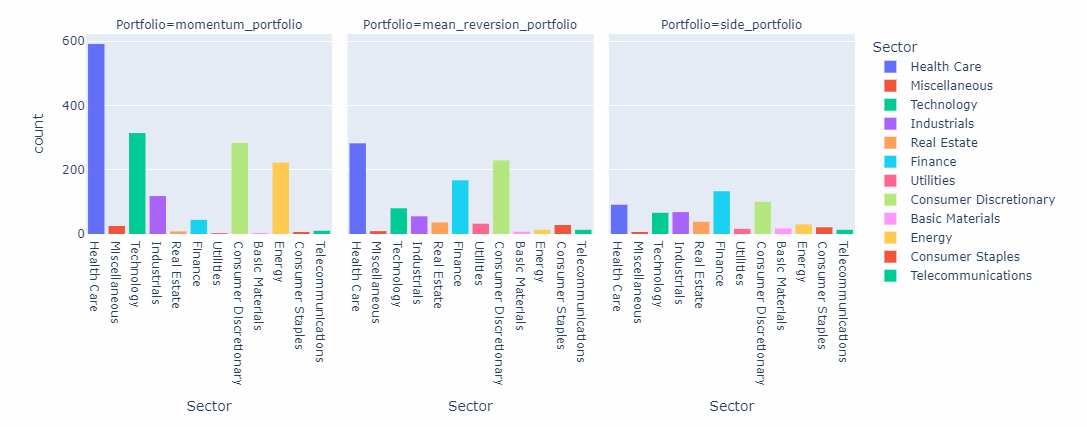
Trades in each Portfolio by Sector. Three bar charts, one for each portfolio, displaying the number of trades made in each sector. These charts highlight which sectors the strategies were most active in and provide insight into how different sector exposures may have influenced overall performance.
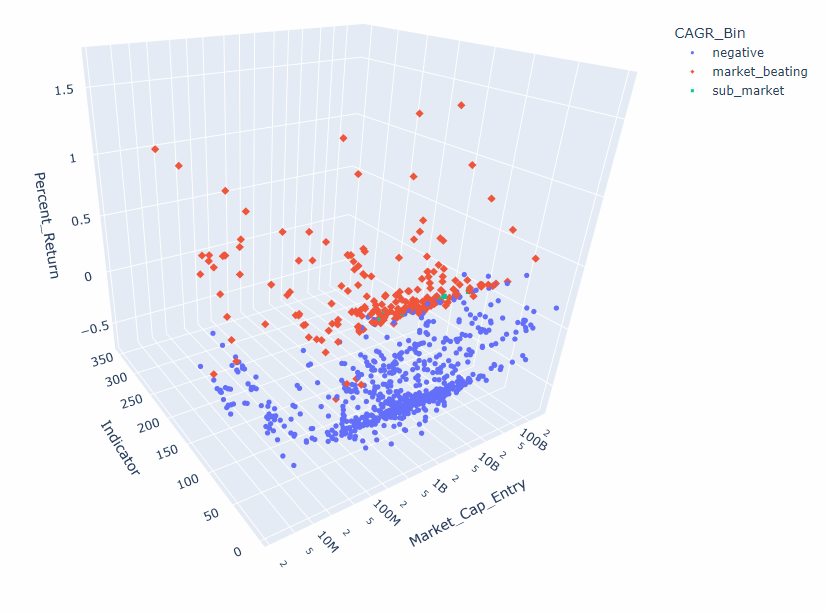
Trade-Level Analysis for Mean Reversion Strategy. A 3D scatter plot where each point represents an individual trade in the mean reversion portfolio. The axes correspond to the market cap of the stock at entry, the value of the custom indicator, and the return of the trade. Points are color-coded by a "CAGR_Bin" (Compouned Annual Growth Rate) variable, indicating whether the trade had a negative return, a positive return that underperformed the market, or a positive return that outperformed the market. This visualization helps uncover patterns in how certain types of trades perform based on their entry conditions.
Next Steps
While building the backtest system was a great learning experience, future
versions will use prebuilt frameworks to focus more on strategy development. One
planned feature is applying NLP to SEC filings. By training a language model on
company reports and measuring shifts in perplexity, I hope to detect changes in
tone that signal upcoming stock reversals.
Summer 2024 – Present
Real Estate Momentum Dashboard
This project is an interactive dashboard that I built in R with the ggplot2, tidyverse, DT, and shiny libraries to help visualize momentum trends in U.S. real estate markets for Professor Brian Melzer (Tuck School of Business, Dartmouth College). It identifies which areas are likely to continue outperforming based on past performance and other variables. The dashboard allows users to choose features to train a linear model to predict the performance of real estate markets over the next term (also selected by the user). This data is visualized as a heatmap of predicted top-performing U.S. markets over the next term.
Data Sourcing and Processing
This tool leverages Zillow data on average home prices and rents in different
real estate markets, combined with CPI data from the Bureau of Labor Statistics
to adjust prices for inflation. Each real estate market in the dataset
corresponds to a specific city or county in the U.S. Historical housing and
rent data were cleaned and aligned across hundreds of markets. From the raw
price data, forward returns (used as prediction targets) and past returns (used
as features) were computed for various time horizons. To allow for
inflation-adjusted comparisons, prices were converted to real terms using CPI
multipliers tied to the selected date.
Predictive Features and Targets
The dashboard supports flexible feature selection, allowing the user to pick
which of the following features they want the model to use for prediction:
- Past returns (6-month, 1-year, 5-year)
- Percentile of Past returns (6-month, 1-year, 5-year)
- Price-to-rent ratio
- Real or nominal price
- Region size rank
The user can pick which of the following targets they want to predict:
- Future returns (6-month, 1-year, 5-year)
- Percentile of Future returns (6-month, 1-year, 5-year)
These features and targets are passed into a linear model trained on historical data available before the selected date, which then outputs a ranked list of expected returns by region.
Visualization
The primary output of the dashboard is a heatmap of the U.S. that shades states
by their predicted average return over the forward-looking prediction term
(6-month, 1-year, 5-year). Below the map is a sortable table that displays the
top regions along with key attributes including those used in the prediction.
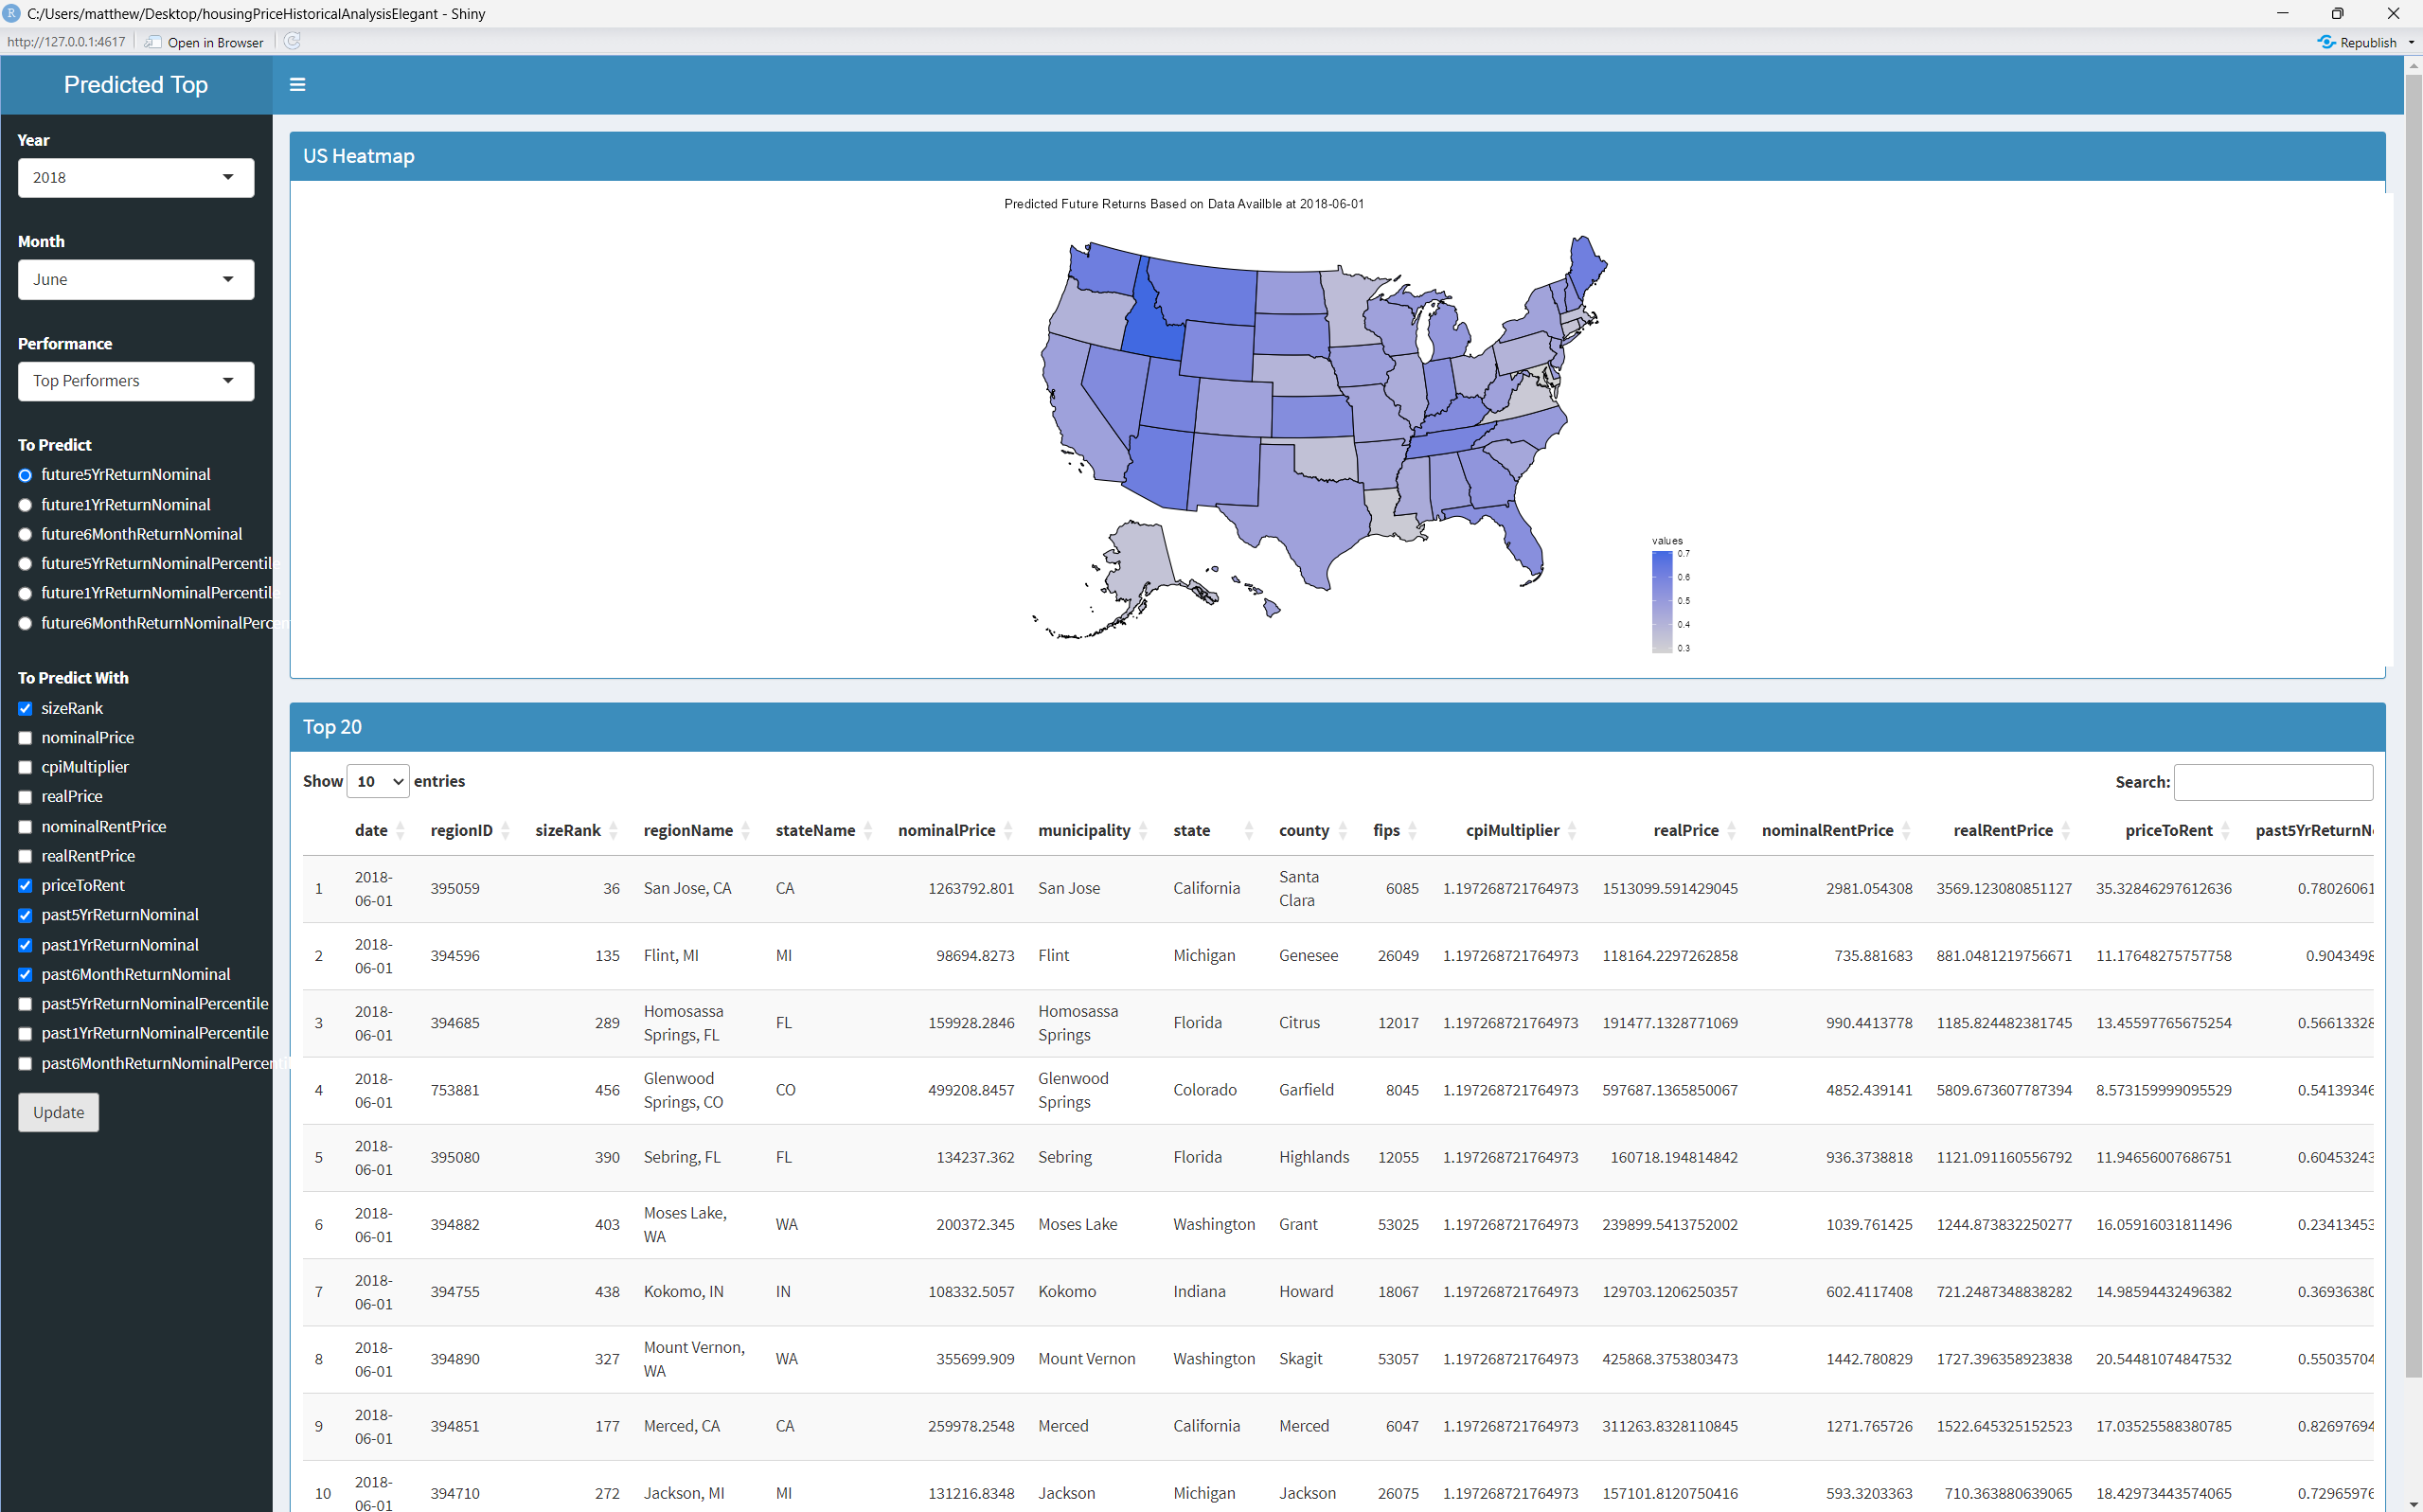
Dashboard Example Usage This is a screenshot of the dashboard showing a prediction of the return over the next 5 years after June 2018 based on the region's size rank, price-to-rent ratio, backward looking nominal returns from 6 months, 1 year, and 5 years.
Insights and Applications
This dashboard makes it easy to spot where momentum is strongest across U.S.
housing markets. Users can fine-tune predictions by layering in valuation
metrics like price-to-rent ratio and real price levels, helping surface regions
that may be both trending and undervalued. The tool provides a fast, intuitive
interface for exploring these patterns and testing custom forecasting setups
with just a few clicks.
Summer 2023 – Summer 2024
Consumer Review Bias Sentiment Analysis
Hanover, NH
Used sentiment analysis and machine learning to identify statistically significant consumer bias given to smaller companies on star ratings of Amazon reviews.
Summer 2021
Education
Bachelor of Science in Mathematics and Economics with a Minor in Computer Science
Union College – Schenectady, NY
- Awarded Presidential Scholarship for merit.
- Bloomberg Market Concepts (BMC) certification – completed modules on economic indicators, currencies, fixed income, equities, commodities, equity options, portfolio management, and Bloomberg Terminal basics.
- Student Investment Fund Co-President - Co-manage over $1,000,000 of college's endowment, lead meetings, founded quantitative strategies group.
- Yoga Club Treasurer – Managed budget, coordinated logistics for instructor contracts, and transportation for on and off-campus sessions (Jul 2025 – Jun 2026).
- Beuth House Procurement Chair – Identified and procured resources for events, negotiated contracts with local businesses, collaborated with faculty (Mar 2023 – Nov 2024).
September 2022 – June 2026
Summer@INSEAD
INSEAD Business School – Fontainebleau, France
Two-week intensive program focused on business strategy, management, and operations.
Summer 2022
High School Diploma
Hanover High School – Hanover, NH
- On the swim team for 4 years, elected team captain in senior year.
- Computer Science Teaching Assistant in senior year.
- Founded Hanover High School House Plant Club and grew membership to over 50.
Fall 2018 – Spring 2022
Skills
Software
- Python
- Pandas
- NumPy
- Matplotlib
- Seaborn
- Plotly
- R
- SQL
- Java
- Excel
- Fusion 360
- Tableau
- Machine Learning
- scikit-learn
- TensorFlow
Organizational
- Communication
- Attention to Detail
- Technical Writing
Interests
- Skiing
- Cycling
- Yoga
- Running
- Coffee
- Cooking
- Building Mechanical Keyboards
- FPV Drone Racing